
Introduction
Modern software development organizations often struggle to measure engineering productivity objectively. Leaders frequently rely on subjective evaluations, task completion rates, or lines of code written, none of which reflect actual business value or delivery efficiency. Without standardized metrics, teams end up debugging pipeline delays, enduring long deployment cycles, and suffering high failure rates without a clear roadmap for remediation.
This lack of visibility creates systematic friction between product delivery velocity and infrastructure stability. To address this structural challenge, data-driven engineering organizations leverage standard frameworks established by the DevOps Research and Assessment group. By monitoring automated pipeline analytics, enterprises can measure execution data, isolate operational bottlenecks, and make systemic adjustments to enhance engineering efficiency.
What are DORA Metrics?
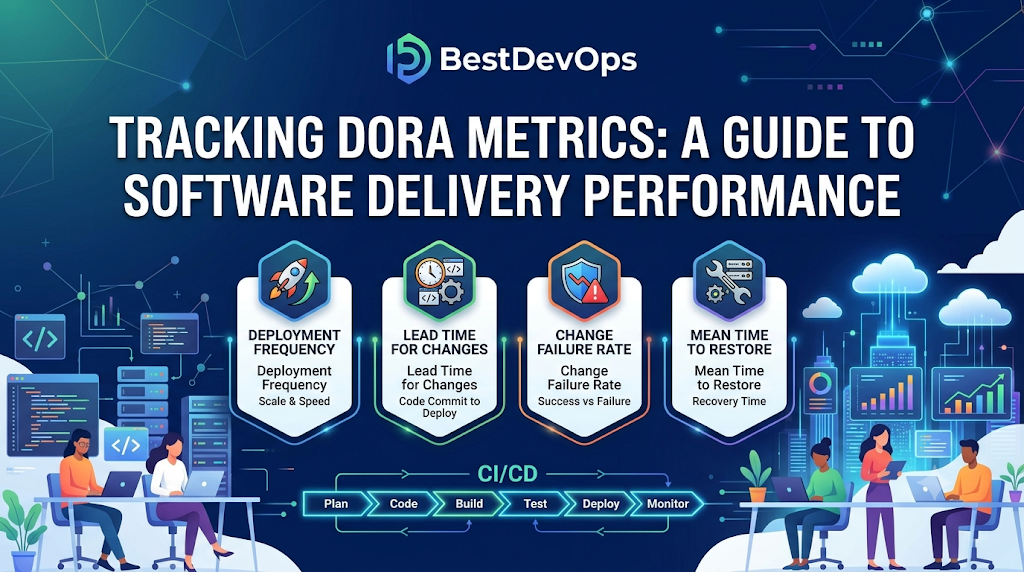
DORA metrics represent a validated framework designed to quantify the performance of software delivery organizations. Developed through years of academic and industry research, this standard categorizes operational performance into four distinct key performance indicators.
+---------------------------------------------------------------------------------+
|                         DORA Performance Framework                              |
+---------------------------------------------------------------------------------+
          |                                               |
          v                                               v
  [ Speed / Velocity ]                            [ Quality / Stability ]
  - Deployment Frequency                          - Change Failure Rate
  - Lead Time for Changes                         - Time to Restore Service (MTTR)
These four metrics are divided into parameters tracking execution velocity and system quality. Deployment Frequency and Lead Time for Changes calculate speed, while Change Failure Rate and Time to Restore Service monitor overall system reliability. Together, they offer a balanced perspective on how effectively an enterprise designs, tests, and deploys production workloads.
Why It Matters: The Link Between Velocity and Stability
Historically, software engineering strategies treated velocity and system stability as a trade-off, assuming faster delivery naturally induced more production incidents. Extensive industry analysis has disproven this assumption, showing that high-performing delivery teams routinely achieve both rapid deployment cadences and exceptional architectural stability.
By tracking execution data, enterprises can replace intuition with verifiable facts. High velocity achieved through smaller, incremental updates diminishes deployment risk, makes code reviews manageable, and isolates faults quickly when incidents occur. Organizations that focus on optimizing these indicators establish smoother development workflows and lower system stress.
About BestDevOps
BestDevOps functions as an educational reference and engineering intelligence resource designed for systems architects, cloud practitioners, site reliability engineers, and software delivery leads. The platform provides structured technical roadmaps, hands-on tool comparisons, deployment tutorials, and certification preparation material covering core enterprise domains like infrastructure as code, container orchestration, and continuous integration pipelines. It also features integrated data-driven analytical insights designed to help teams measure software delivery performance, identify workflow blockages, and systematically evaluate key DORA indicators.
Whether you are an enterprise technical manager seeking to standardize multi-cloud infrastructure, or a software engineer looking to advance your technical delivery skills, the platform provides actionable guides tailored to modern operations. By focusing on practical application architectural patterns and systematic automation frameworks, the platform assists engineering teams in mitigating system friction, strengthening delivery consistency, and managing the underlying complexities of cloud-native development. Professionals seeking to design scalable developer products can leverage these resources to establish a strong structural foundation for evaluating engineering performance through dedicated DORA Metrics Tools configurations.
Common Enterprise Measurement Challenges
- Siloed Execution Ecosystems: Development data is scattered across distinct repositories, issue trackers, CI/CD tools, and incident response portals, clouding aggregate pipeline visibility.
- Manual Data Aggregation: Teams often use spreadsheets to manually trace commit timestamps through production releases, which consumes time and introduces entry errors.
- Goodhart’s Law Pitfalls: When simplistic metrics like individual pull request volumes are targeted, teams alter behaviors unproductively, fracturing overall team collaboration.
- Vanity Performance Indicators: Tracking code coverage percentages or total commits without linking them to production releases creates an illusion of progress without improving delivery efficiency.
Key Concepts of Software Delivery Analytics
Deployment Frequency
This metric measures how often an organization successfully pushes software changes to a production environment, serving as an indicator of automated pipeline capability and operational agility.
Lead Time for Changes
This tracks the total duration from a code commit being merged into the primary branch to its successful execution inside production. It directly reflects continuous integration efficiency.
Change Failure Rate (CFR)
CFR represents the percentage of production deployments that require immediate remediation, rollbacks, or hotfixes, quantifying the reliability of testing workflows.
Time to Restore Service (MTTR)
MTTR calculates the median time required for an organization to recover from a production outage or critical service degradation, emphasizing observability and incident management.
Architectural Workflow of an Automated Metrics Engine
Automated intelligence engines pull real-time webhooks from your development stack to compile delivery insights continuously.
[ Git Provider (Commit/PR) ] ----> Webhook
                                     |
[ CI/CD Engine (Deploy Pass) ] --> Webhook ----> [ Data Aggregation Pipeline ]
                                     |                 |
[ Incident Manager (Alert/Fix) ] -> Webhook                 v
                                                 [ Unified Metrics Dashboard ]
                                                       (Pulse / DORA)
- Event Ingestion: Code updates, pipeline completions, and monitoring events trigger webhooks across the developer environment.
- Contextual Linking: The metrics engine matches individual repository commits with their associated deployment jobs and subsequent incident reports.
- Aggregation: Data handlers compute metrics like Lead Time and Change Failure Rate across configurable intervals.
- Dashboard Visualization: The calculated trends are rendered onto an analytics interface, allowing technical leads to evaluate process improvements.
Real-World Enterprise Use Cases
Identifying Deployment Pipeline Bottlenecks
A cloud services enterprise noticed that despite rapid sprint completions, their production releases occurred only once a month. By implementing automated analytics, the team mapped their Lead Time for Changes and discovered that artifact validation checks regularly stalled for weeks in a manual staging gate. Automating that gate reduced lead times from weeks to days.
Stabilizing Legacy Architecture Transitions
A financial institution modernizing a legacy application used delivery metrics to audit their system migration risk. By continuously monitoring the Change Failure Rate during microservices rollouts, the platform team isolated specific unstable services, adjusted automated test coverage, and protected production environments from systemic outages.
Technical and Business Benefits
- Data-Driven Decision Making: Engineering investments are guided by empirical data rather than speculative assumptions.
- Lower Production Risks: Deploying smaller, frequent code increments minimizes the blast radius of any individual production error.
- Improved Developer Experience: Pinpointing and removing pipeline bottlenecks reduces developer friction and operational frustration.
- Greater Operational Agility: Efficient deployment pipelines allow organizations to release new features and patches ahead of market competition.
Best Practices for Tracking Performance Indicators
Automate Telemetry Extraction
Do not rely on manual status updates or developer surveys to measure delivery trends. Configure webhooks directly inside your Git repositories, CI/CD runners, and alerting systems to capture objective timestamps.
Assess Trends Over Individual Snapshots
Evaluate software delivery performance across rolling multi-week windows. Spikes in failure rates occur naturally during major upgrades; analyzing the baseline trend over time provides a more accurate view of system stability.
Share Metrics Contextually Across Teams
Use performance insights to encourage continuous improvement rather than as a performance grading mechanism. Frame metrics as a diagnostic tool designed to help developers optimize their daily delivery workflows.
Common Mistakes to Avoid
- Weaponizing Analytic Data: Using delivery velocity metrics to rank developers destroys team trust and encourages gaming the tracking system.
- Fixating on Velocity Alone: Pushing for high deployment frequencies without checking the Change Failure Rate leads to system instability and operational burnouts.
- Neglecting Cultural Alignment: Tools alone cannot fix poor performance; true engineering success requires supporting automation, clear communication channels, and blameless retrospectives.
Implementation Strategy and Roadmap
A structured approach to measuring delivery performance minimizes friction and clarifies team objectives:
Phase 1: Tool Integration (Connect repositories, build systems, and incident trackers)
                         |
                         v
Phase 2: Baseline Quantification (Log current delivery metrics for 30-45 days)
                         |
                         v
Phase 3: Targeted Optimization (Refine automated testing or deployment workflows)
                         |
                         v
Phase 4: Continuous Auditing (Review metrics inside retrospectives to maintain standards)
- Connect Your Toolchain: Map webhooks from version control systems and continuous integration configurations into your tracking dashboard.
- Establish Current Baselines: Collect metric data for several weeks without altering workflows to establish an accurate performance baseline.
- Address the Largest Bottleneck: If Lead Time is high, optimize build automation. If CFR is high, expand automated test scenarios inside non-production clusters.
- Incorporate Metrics into Reviews: Analyze performance trends inside team retrospectives to guide optimization investments.
Traditional Metrics vs. DORA Metrics
| Operating Dimension | Traditional Engineering Metrics | DORA Metrics Approach |
| Primary Focus | Individual output parameters like code volume or total task hours. | Systemic team delivery velocity and overall system quality. |
| Data Collection | Manual inputs inside task tracking boards. | Automated webhook collection directly across the toolchain. |
| System Behavior | Encourages siloed code production over team delivery goals. | Balances deployment velocity with operational stability. |
| Business Alignment | Weak correlation to overall product time-to-market. | Direct correlation to software stability and features shipped. |
Career Guidance: Developing Data-Driven Engineering Skills
As enterprises increasingly build decisions around delivery telemetry, professionals who understand analytics tracking stand out in the technical market.
Required Skill Sets
- Pipeline Instrumentation: Configuring analytical hooks within Git providers, container systems, and deployment configurations.
- Systems Observability: Monitoring execution states using open standards like OpenTelemetry alongside structured alerting tools.
- Automation Design: Managing declarative workflows with infrastructure engines like Terraform, Ansible, or cloud-native tooling.
Recommended Learning Pathways
Practitioners can build proficiency through structured training resources:
- Core Engineering Roadmaps: Evaluate a complete DevOps Roadmap to master the concepts behind infrastructure automation and delivery lifecycles.
- Practical Frameworks: Follow step-by-step DevOps Tutorial for Beginners guides to gain hands-on experience building foundational build pipelines.
- Technical Certifications: Validate your engineering knowledge by exploring the Best DevOps Certifications available across major cloud platforms.
- Comprehensive Courses: Enroll in a targeted Best DevOps Course to master advanced delivery strategies, metrics aggregation, and container management patterns.
Skill Assessment and Progression
Honing your technical presentation and systems evaluation skills is critical for senior engineering roles. Practitioners can review curated DevOps Interview Questions to practice explaining pipeline design, risk mitigation, and tracking methodologies.
As teams optimize delivery parameters, engineering management roles naturally open up. To understand structural market trends and compensation paths, review detailed DevOps Engineer Salary evaluations to plan your career progression.
Frequently Asked Questions
Q1. How do we prevent development teams from gaming DORA metrics?
The most effective approach is to frame these indicators as diagnostic tools for the collective team rather than individual evaluation metrics. When leaders focus on removing systemic pipeline friction instead of tracking individual performance, teams use the data honestly.
Q2. What is an ideal Change Failure Rate for an enterprise organization?
High-performing enterprise organizations typically aim to maintain a Change Failure Rate between 0% and 15%. However, target percentages vary based on industry regulations, product maturity, and the team’s specific risk tolerance.
Q3. Can we track software delivery performance manually using spreadsheets?
While manual tracking is possible for tiny teams, it quickly becomes unmanageable at scale. Manual collection delays insights, introduces reporting errors, and distracts engineers from core development tasks.
Q4. What is the difference between monitoring and observability in this context?
Monitoring tracking alerts you when a deployment pipeline or production environment fails. Observability allows you to drill down into logs, traces, and metrics to understand exactly why the system failed or where a deployment bottleneck sits.
Q5. How often should a high-performing engineering team deploy code?
According to industry benchmarks, elite teams deploy code on demand, frequently completing multiple successful production releases per day. This cadence is achieved by breaking changes down into small, low-risk software increments.
Q6. How does infrastructure as code affect delivery metrics?
Infrastructure as Code significantly reduces Lead Time for Changes and Time to Restore Service. Managing your environments declaratively through code allows teams to provision resources and recreate staging environments rapidly without manual intervention.
Q7. Which tools are commonly used to aggregate pipeline metrics?
Organizations use specialized optimization platforms, Git reporting suites, and continuous delivery analytics engines to parse system events and visualize performance data.
Q8. Should startups focus on tracking these indicators early on?
Yes, establishing clean deployment paths early on helps prevent the accumulation of technical debt and messy release workflows as the startup scales its engineering team.
Conclusion
Measuring engineering output through objective metrics gives organizations a clear framework for optimizing their delivery lifecycles. Balancing deployment velocity with strict system stability controls allows development teams to eliminate guesswork, accelerate feature delivery, and maintain stable software environments.
However, building a metrics-driven engineering organization involves more than just setting up analytical dashboards. Lasting success relies on an open engineering culture, solid automation, comprehensive observability, and a commitment to data-driven improvements. Tracking execution metrics through comprehensive optimization engines like DevOpsIQ provides teams with the precise data insights needed to clear delivery bottlenecks, support developer talent, and build a highly responsive enterprise delivery strategy.
